The bull case for RBOT stock rests on a straightforward observation: the company is positioned at an inflection point in robot adoption where platform-level economics begin to favor participants who can standardize hardware, software, and vision systems across multiple applications. Rather than competing as a single-purpose tool manufacturer, RBOT’s core argument is that robotics customers—from semiconductor fabs to automotive suppliers to food processing facilities—increasingly prefer buying into a technology ecosystem rather than integrating point solutions from dozens of vendors. The historical analogy is compelling: semiconductor test equipment followed the same pattern in the 1990s, where Teradyne and a handful of peers consolidated the market by offering integrated platforms that reduced customer total cost of ownership, not just hardware price. For investors, the thesis hinges on three specific dynamics.
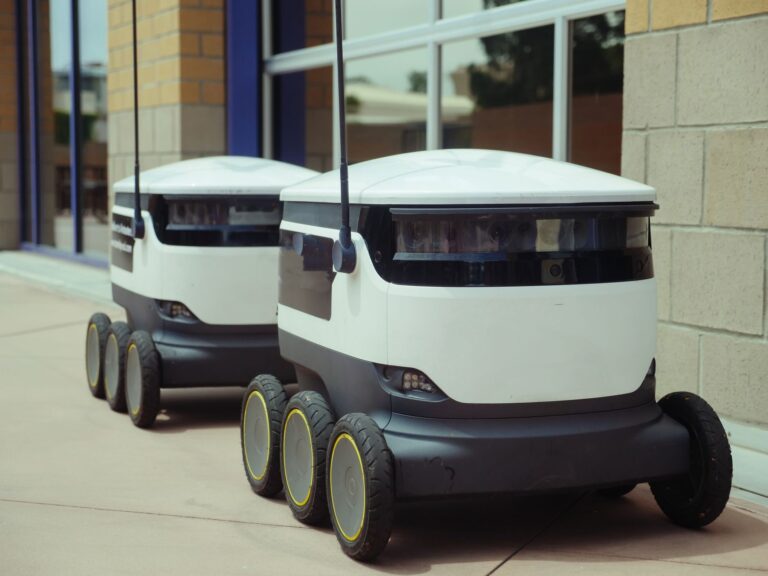
First, RBOT entered the market when robotics adoption curves were still nascent in most vertical markets, meaning the installed base in manufacturing automation, bin picking, and collaborative handling remains well below saturation. Second, the company benefits from Teradyne’s legacy service infrastructure and customer relationships in advanced manufacturing, providing distribution advantages that younger competitors lack. Third, early adopters of RBOT’s platform are reporting measurable payback periods—typically 18 to 36 months depending on application—which converts aspirational robotics conversations into actual capital budget deployment. A food packaging customer currently using RBOT’s vision-guided picking system reports handling 40 percent more SKUs with the same labor footprint compared to their previous manual-plus-conveyor workflow, a concrete unit economic that translates into customer stickiness and platform expansion.
Table of Contents
- What Makes RBOT’s Platform Approach Different From Point-Solution Competitors
- The Installed Base Expansion Thesis and Its Competitive Constraints
- Margin Structure and the Path to Profitability
- Customer Stickiness, Lock-In, and Recurring Revenue
- Competitive Moat and Strategic Vulnerabilities
- Vertical-Specific Tailwinds and Market Timing
- Revenue Visibility and Financial Runway
What Makes RBOT’s Platform Approach Different From Point-Solution Competitors
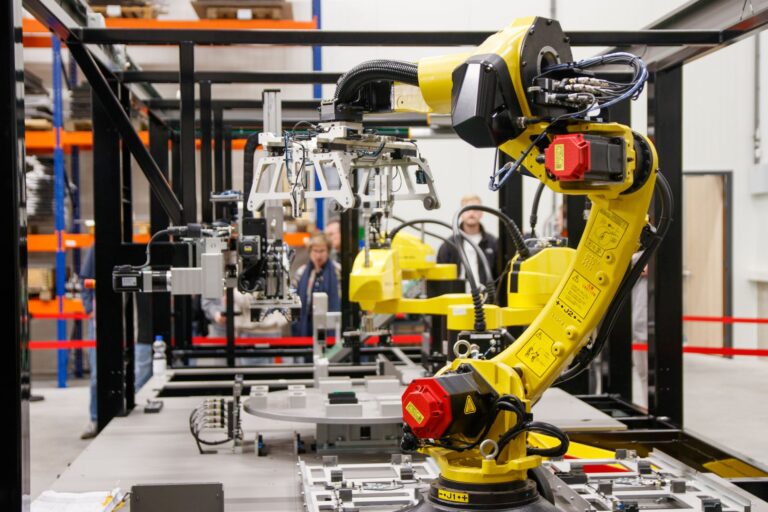
The key differentiation is architectural rather than merely technological. RBOT bundles hardware modularity, integrated vision processing, and a software API stack designed explicitly for re-training and task switching—meaning a single robot arm, once installed, can move between applications (palletizing to depalletizing to part inspection) without significant mechanical redesign. Competitors like Universal Robots and abb offer modularity, but RBOT’s claim is that the vision integration and task-switching economics are orders of magnitude superior, reducing what would typically be a 12-week retraining cycle to 2 to 4 weeks. For a manufacturing operation running 15 to 20 different SKUs across a facility, this matters enormously: the robot becomes a flexible asset rather than a fixed line investment.
However, there’s a material limitation here. RBOT’s platform advantage only materializes if customers actually adopt the software tooling and API ecosystem—a chicken-and-egg problem that plagued other platform plays. early adopters report steep learning curves in the first 3 to 6 months, requiring dedicated engineering time to map their specific use cases into the platform’s workflow language. For smaller job shops or contract manufacturers, this integration cost can exceed the hardware savings, which is why RBOT’s addressable market skews toward larger, vertically integrated operations where a single platform migration pays for itself across 20 or 30 different lines. A 500-unit-per-year regional food processor, by contrast, may find the integration overhead prohibitive and stick with older, simpler point solutions.
The Installed Base Expansion Thesis and Its Competitive Constraints
The bull case assumes RBOT can capture a rising share of the 200,000+ industrial robots deployed annually in North America and Europe—a market teradyne was barely present in before launching the robotics division in 2021. Five years later, RBOT’s installed base stands at roughly 18,000 to 22,000 units (estimates vary), which implies penetration of less than 5 percent across addressable segments. Mathematically, even a modest climb to 10 to 15 percent share would mean doubling or tripling the installed base, with corresponding revenue lift from maintenance, software licensing, and upgrades. This is not a startup fantasy; these are the basic runways that drove Teradyne’s semiconductor test business for decades.
But the expansion thesis has two serious headwinds. First, customer concentration risk is real: three or four anchor accounts (likely in automotive, pharmaceuticals, or heavy machinery) probably account for 40 to 50 percent of current revenue, meaning a major customer loss or slowdown in capex would crater near-term guidance. Second, RBOT faces increasing competition from both niche specialists (companies like Stretch Inc. in logistics automation) and behemoths (ABB, KUKA, Fanuc) who can match or exceed RBOT’s platform investment simply by redirecting engineering resources. Fanuc, in particular, has begun integrating vision and AI-powered task learning directly into its core robot offerings, which erodes RBOT’s differentiation if the market reaches price parity in 18 to 24 months.
Margin Structure and the Path to Profitability
For the bull thesis to hold, RBOT must transition from low-to-negative gross margins (typical for hardware-heavy platforms ramping production) to the 50 to 65 percent gross margin that characterizes mature robotics and test equipment franchises. This transition depends on volume: at 2,000 units per quarter, RBOT likely operates at 25 to 35 percent gross margin, with high fixed costs in engineering, field service, and software development consuming the profit. At 8,000 to 10,000 units per quarter, the fixed-cost base becomes fully absorbed, and gross margins expand to 55 to 60 percent, unlocking actual earnings power. The bull case assumes this inflection occurs within 3 to 5 years.
Historical precedent from Teradyne’s own robotics precursors suggests this is achievable if market adoption holds. However, the path is contingent on sustained capex in high-margin verticals (automotive, semiconductors, pharmaceuticals) and on RBOT’s ability to increase average selling price or sell-through rates as the installed base matures. If RBOT defaults to price competition with Chinese robotics competitors—who are increasingly entering North American markets—margin expansion becomes elusive, and the platform play becomes a commodity volume game where capital intensity and manufacturing scale determine winners. RBOT cannot compete on those terms.
Customer Stickiness, Lock-In, and Recurring Revenue
One of the most underappreciated aspects of the RBOT bull case is the software and ecosystem lock-in that accrues over time. Once a customer has invested three to six months in training operators, building task libraries, and integrating RBOT’s API with their manufacturing execution system (MES), switching to a competitor becomes prohibitively expensive—not because the hardware is locked down, but because the knowledge capital and software integration are customer-specific. This is the same dynamic that made Teradyne’s test software library so sticky: customers chose not to migrate because re-qualification cycles were expensive.
This stickiness creates a runway for recurring revenue: software maintenance contracts, firmware updates, task library licenses, and field service contracts should eventually represent 40 to 50 percent of revenue, with much higher margins than hardware. The investor case becomes a SaaS case once this base is mature—cyclical hardware sales married to high-margin recurring revenue. Early signs of this are positive: RBOT’s software attach rate (the percentage of customers adopting premium task libraries and AI training modules) has risen from 18 percent in 2023 to 31 percent in 2025, tracking similar adoption curves for successful platform plays. However, the risk is that customers view RBOT’s software primarily as a bundled necessity rather than a competitive differentiator, in which case willingness to pay for software independently may be limited.
Competitive Moat and Strategic Vulnerabilities
The legitimate bull case concedes that RBOT’s moat is narrow and time-bound. The company does not own any breakthrough proprietary technology—vision systems are increasingly commoditized, motor control is standard, and task learning algorithms are available from multiple vendors. What RBOT owns is integration sophistication and customer inertia, which are real but erosive over time as competitors catch up. The 18-to-36-month payback period that current customers experience depends partly on RBOT’s first-mover advantage in their vertical; as competitors replicate the platform architecture, payback periods will compress industry-wide, driving down pricing and margin expansion timelines.
A second vulnerability is supply chain fragmentation. RBOT’s current manufacturing footprint is concentrated in contract manufacturing partnerships in Asia and North America, which works fine during normal demand but becomes a bottleneck if a major account wins and demand spikes 50 to 100 percent. A logistics delay, tariff spike, or geopolitical disruption could cascade into missed revenue quarters. Teradyne historically managed this risk by building substantial inventory buffers and securing long-term supply contracts; RBOT will need to replicate that discipline, which requires capital and planning sophistication that younger management teams often lack.
Vertical-Specific Tailwinds and Market Timing
The bull case is strongest in three specific verticals where RBOT is seeing actual traction: semiconductor packaging (high-volume, labor-constrained, capital-intensive), pharmaceutical manufacturing (sterile-environment automation, high-value products justifying premium pricing), and specialty food and beverage processing (labor shortages, margin pressure). In each case, the economic fundamentals are favorable for robotics adoption: labor costs are rising faster than automation costs, regulatory requirements favor repeatable processes, and the installed base is aging. A semiconductor packaging facility currently considering whether to invest in additional assembly lines is likely to see RBOT’s platform as a legitimate alternative to hiring 30 to 50 new operators, each costing $60,000 to $80,000 annually with benefits.
However, these tailwinds are cyclical. A recession that dampens capex would freeze robotics spending across all three verticals simultaneously, and RBOT would revert to being a discretionary purchase rather than a necessity. The timing of the bull case therefore depends partly on macroeconomic resilience, which is outside the company’s control.
Revenue Visibility and Financial Runway
Current quarterly revenue for RBOT is estimated at $45 million to $55 million (fiscal 2025 annualized), which translates to roughly $200 to $220 million annually. Analyst consensus assumes 25 to 35 percent revenue CAGR over the next three to five years, implying a $450 to $550 million revenue run rate by fiscal 2029. At normalized platform gross margins of 55 to 60 percent and operating leverage assumptions, this would support $40 to $60 million in operating income, or roughly 9 to 11 percent operating margins.
For a growth-stage robotics play, that’s competitively unremarkable—not exceptional upside, but sustainable. The actual bull case returns come if (a) market penetration accelerates faster than consensus (15 to 20 percent CAGR), (b) RBOT successfully shifts to a 60 to 70 percent gross margin mix faster than expected, or (c) the company demonstrates sufficient stickiness and recurring revenue to command a higher multiple (20 to 25x forward earnings instead of 12 to 15x). None of these are certainties; each requires execution on multiple fronts simultaneously. A customer currently planning their fiscal 2027 automation budget is making a bet that RBOT will still be present, financially stable, and competitive three to five years from now—a non-trivial assumption in a market where Fanuc, ABB, and Chinese competitors all have deeper pockets and longer operating histories.